


Quality: Starting with Effective Data Management
How Automaker Adoption of In-Process Testing 20 Years Ago Laid the Groundwork for Industry 4.0
By Richard Brine
Without data you cannot make optimal decisions
A lofty definition of Industry 4.0 is “a number of contemporary automation, data exchange and manufacturing technologies that create a ‘Smart Factory,’ where cyber-physical systems monitor physical processes and can make decentralized decisions.”

In other words, collect the right data with the right level of granularity. Act on what that data reveals in near real-time on the production line, and store the data in a central repository where it can be analyzed, correlated, and visualized to the individual serial number. Use this insight for continuous process improvement and to ensure the quality of your product and overall yield is a close to perfection as possible.
Many manufacturers continue to rely on execution systems that collect scalar data. Just a few data points are collected from each process on the line. Take press fitting, for example. Only the final pressure reading may be collected. But this doesn’t tell you if more force than usual was required to achieve the final fit, or if the process took longer than usual. These details may indicate faulty parts or some other deviation that can lead to a failure and a warranty claim down the road.
It all began in automotive
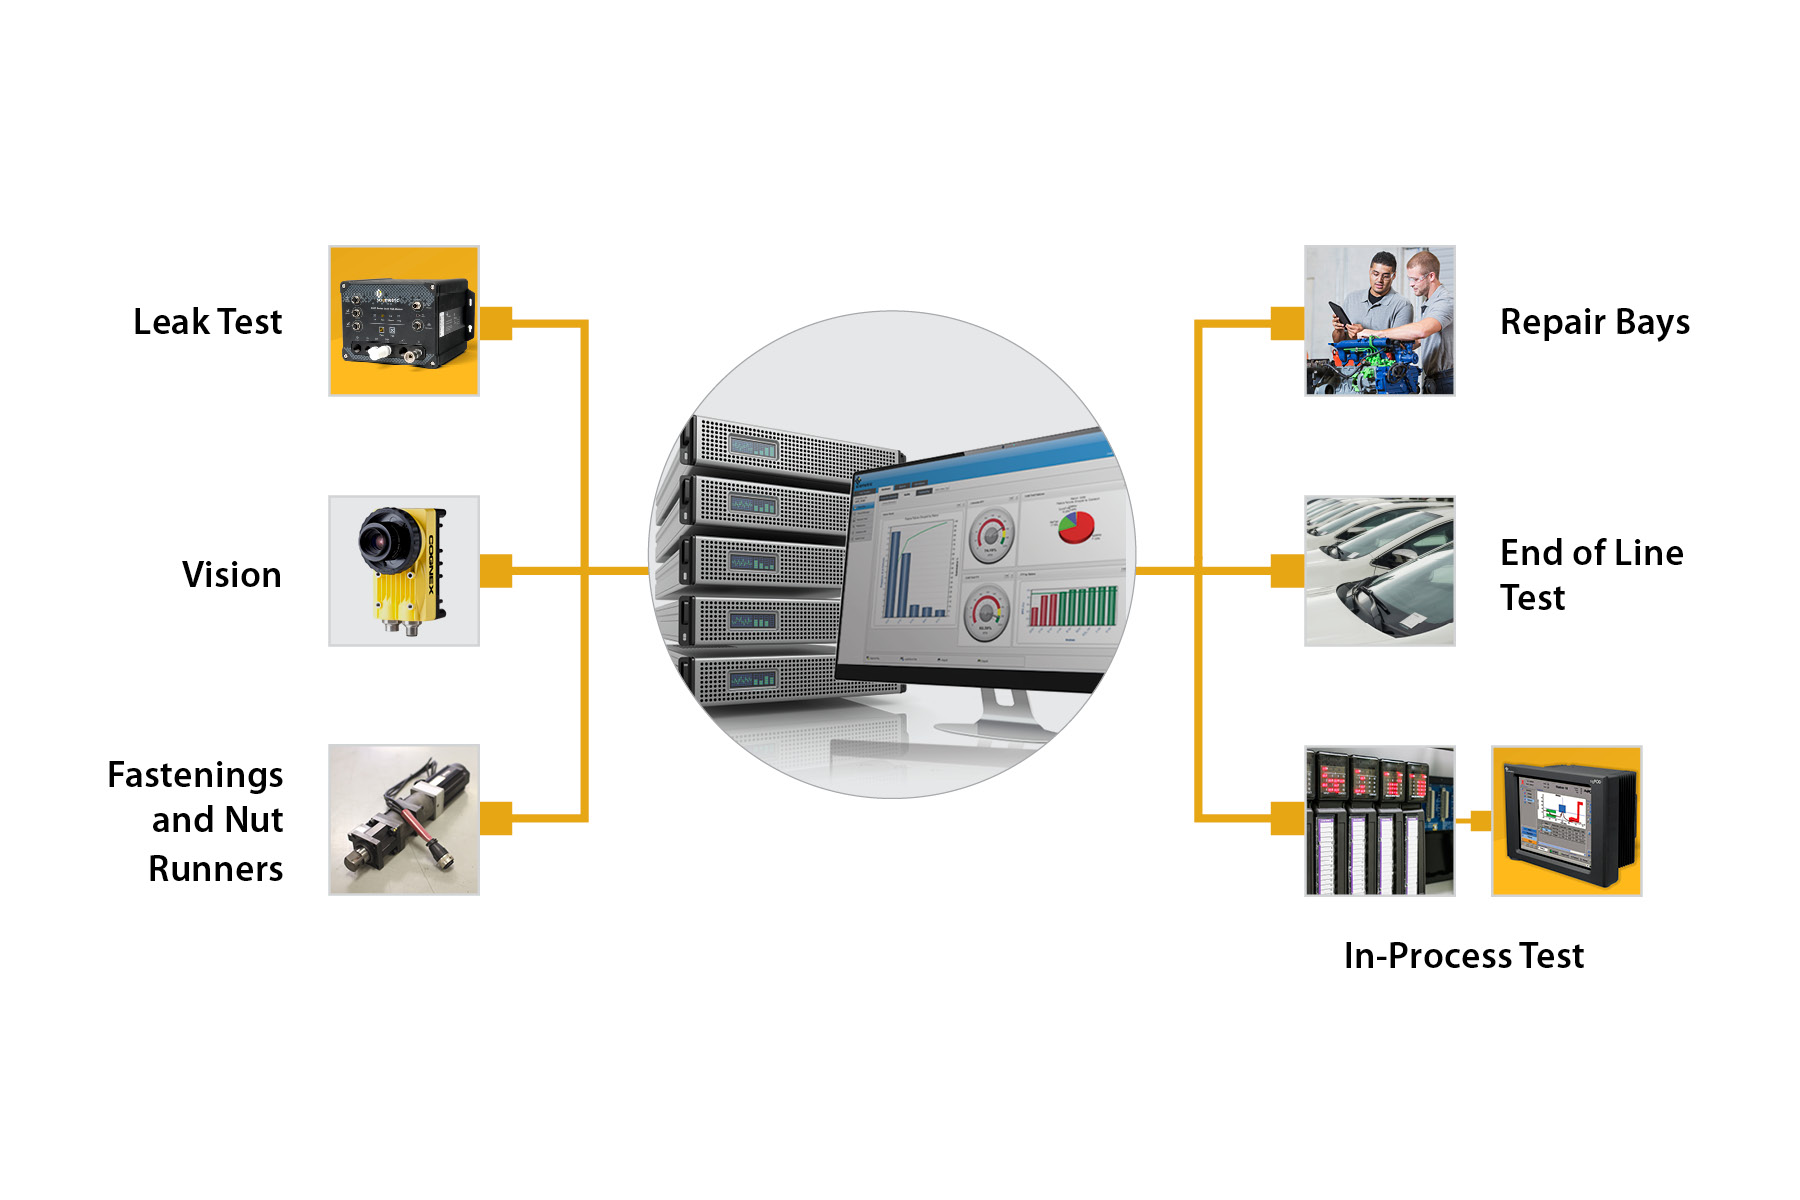
If you equip the stations on a production line with the right sensors, it’s possible to capture the full waveform of the process – not a few, but thousands of data points. A digital fingerprint that contains every detail of what happened during that process, in millisecond or micro-second increments. Analyzing this waveform, to understand what is happening during the process, is called signature analysis.
We realized this back in the early 1990s, when we developed a signature analysis solution for an auto maker to verify valve seat and valve guide assembly operations. Signature analysis proved ideal to monitor force versus distance when parts were pushed into a cylinder head casting, to ensure the right fit without damage.
We then engaged with another automaker interested in a better alternative to end-of-line hot tests for its engines. Working with its team, we looked at all key assembly operations on the line to understand which processes could be measured more precisely to detect errors and identify bad parts or expose bad assembly operations immediately rather than waiting to detect them down stream.
In each instance where some chance of error persisted, we imagined how we could measure and qualify the process with signatures or waveforms to verify perfection and spot problems quickly.
The results of our trials were so impressive the automaker decided to integrate in-process testing technology into every plant it had around the world as new lines were built. This multi-billion-dollar investment took a decade to implement. But the ROI was fantastic and the cost was recouped almost immediately through the cost savings of dropping the hot test. Equally important, the quality and productivity of these assembly lines was superb – best-in-class for the industry.
No one called it “Industry 4.0” back then, but looking back, it’s clear that we had laid the groundwork.
When should you collect the data?
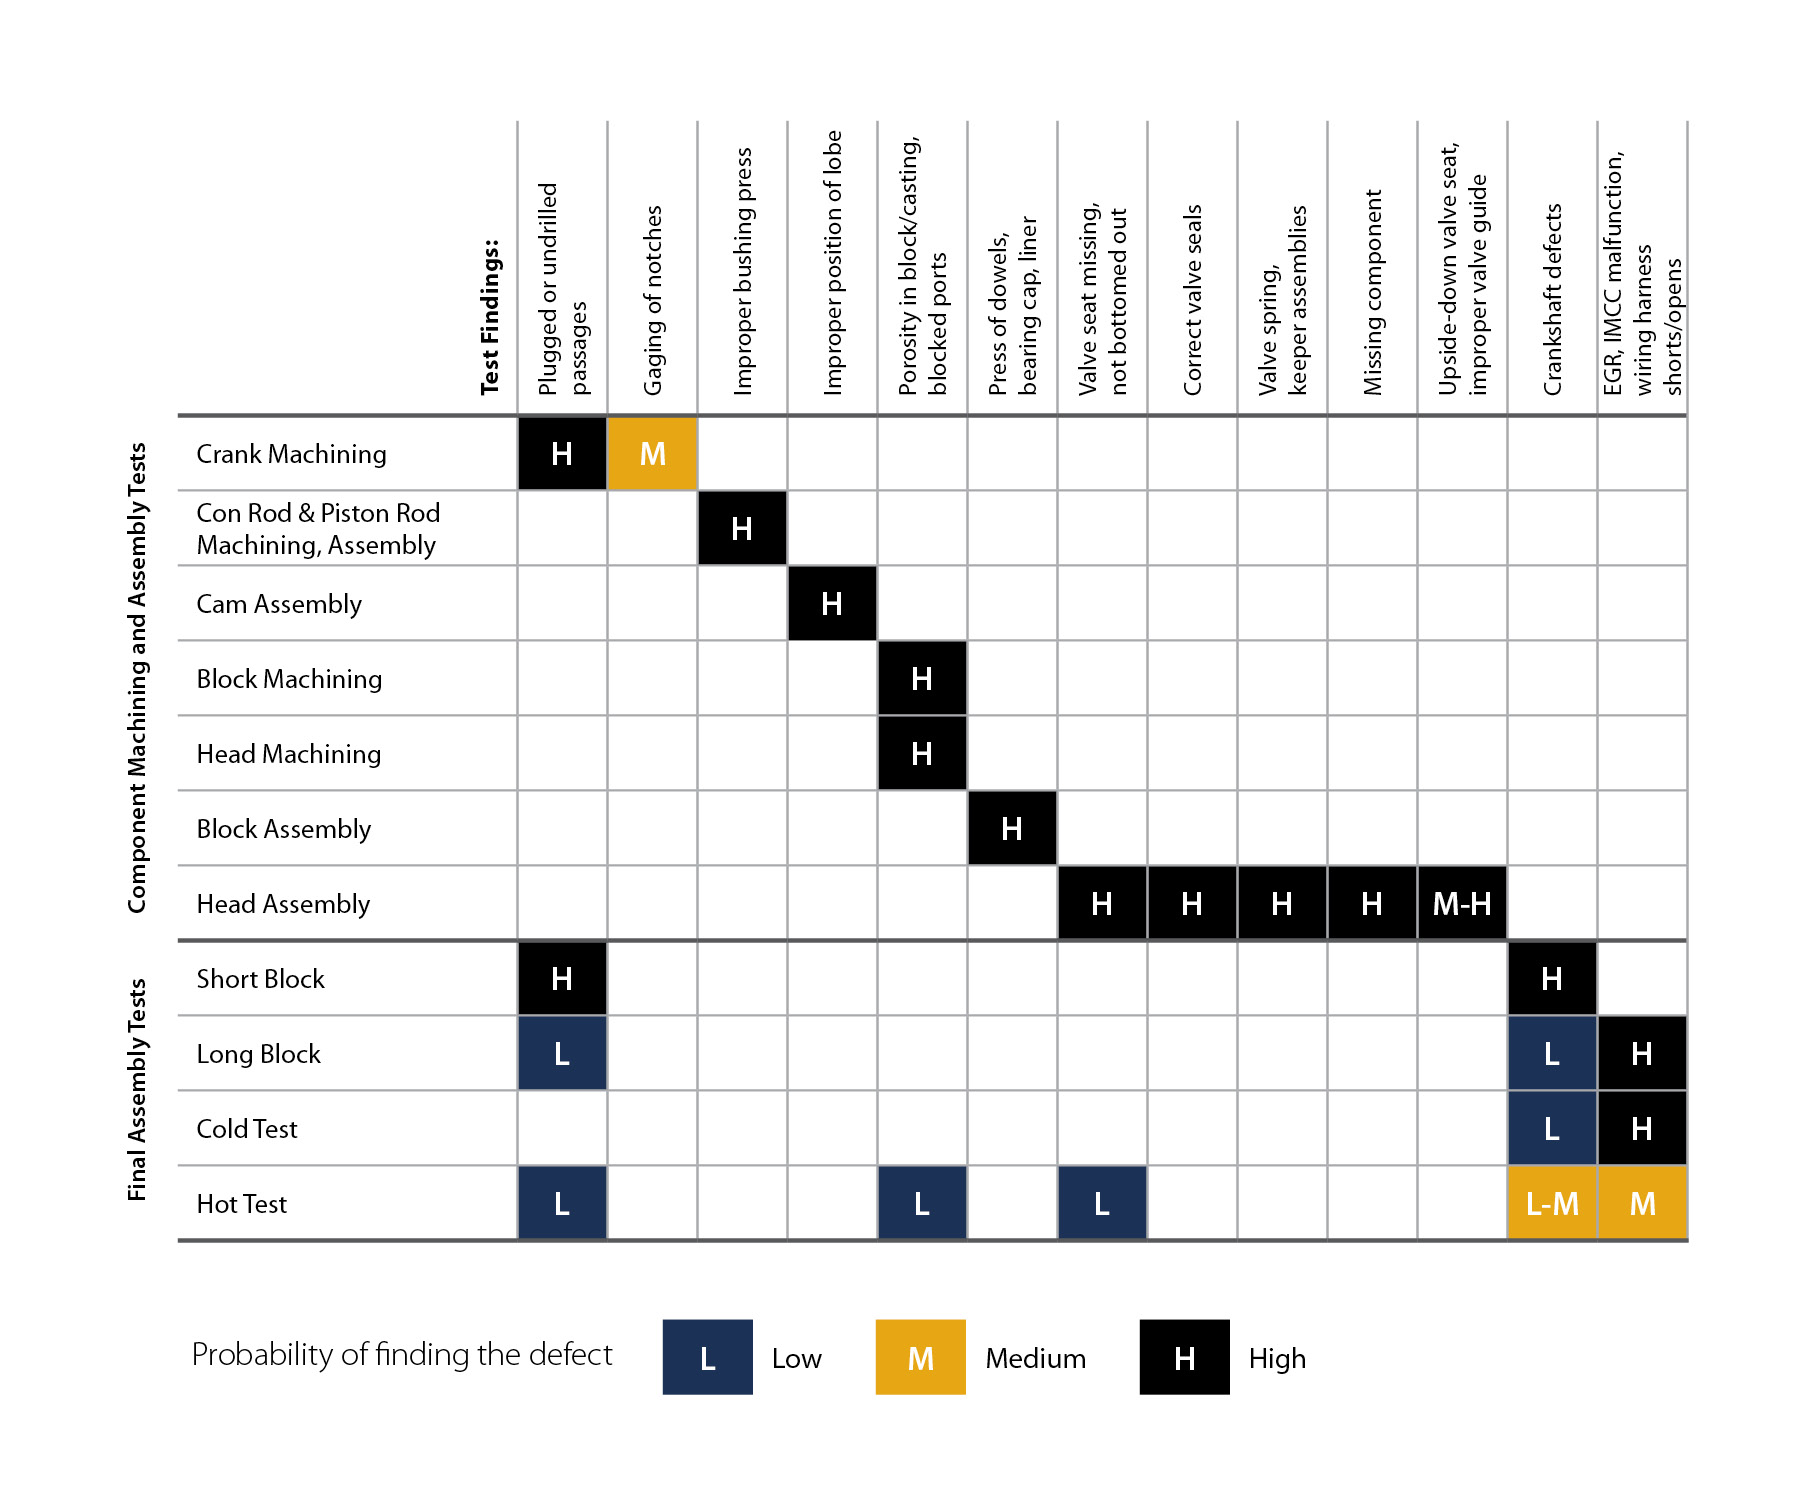
 Take something as complex as an engine. It’s very difficult with an end-of-line test to catch if a piston ring was installed upside down, if oil galleries are plugged or misaligned, or if a valve seat is not fully pressed. When that engine fires up, there are too many variables and too much distortion from background noise for even the most sophisticated and sensitive equipment to find those needles in the haystack.
You must collect the data where it has the highest fidelity and quality, where the signal to noise ratio is at its highest. That means collect it in real-time, from every important process. It doesn’t matter if that process is a press fit, a weld, a rundown operation, or dispensing a bead of sealant or adhesive – there is a place where a sensor can be added and data collected.
Take a weld, for example. There are so many variables at play at the same time – voltage, current, distance, force. If you don’t capture all this data as complete waveforms during the process, there is no record to refer back to in the event of a future failure. You have no way of refining the test for continuous process improvement.
Without in-process testing that captures the entire waveform, your only alternative may be destructive testing.
Now how do you harness all that data?
Collecting data is one thing. Making effective use of it is another.
According to Frost and Sullivan’s 2015 Global Big Data Analytics Market for Test and Measurement report, up to 80 per cent of process data collected is “disparate and inaccessible – scattered across multiple devices, systems, and data stores.”
 Gartner finds that, on average, 70 per cent of factory data goes unused, and concludes that “this will be a risk as the factory of the future unfolds.”
Breaking down silos is crucial. At one major manufacturer, it took two weeks to track down the full birth history of a single part because the data is scattered among so many different databases.
It doesn’t even have to be something as complex as a whole engine. Take an oil pan that fails a leak test. What is the cause of the failure – a faulty gasket due to improper dispensing, an improperly installed gasket due to incorrect position, bolts that didn’t tighten down correctly, poorly machined surfaces due to excessive vibration at a machining center? How many different gaskets and bolts are we talking about?
Getting to the root cause of this flaw could require investigation of a dozen or more machining, dispensing, fitting and rundown operations, each with its own data set.
All this in process waveform data must be collected into a single central database where it can be correlated. Only then can you apply modern visualization and analytical tools to see causal effect, find root cause, and understand machine behavior.
Otherwise, thousands of faulty units could roll of the line before corrective action can be taken. Thousands of units that don’t have to be are caught up in a recall.
This is the big data challenge manufacturers face with Industry 4.0.
Use all this data to boost first-time yield
Once you have the tools in place to capture all this waveform data and employ the analysis and visualization tools to make the most of it, the next consideration is yield.
Catching a specific problem as it occurs and getting to the root cause quickly is just the beginning. This wealth of data can also spotlight emerging trends and patterns before they become a production issue that leads to higher scrap and rework rates.
Statistical analysis can tell you if a process is drifting or a yield is lower, but only the depth of data that comes from waveform analysis can trace the root cause and enable continuous process improvement. Test limits can be tightened and test cycle times shortened to boost the speed and efficiency of any test on the line.
It’s analogous to a CT scan versus an MRI – the latter can yield a clearer picture of what is going on inside than the former. We are quickly moving to the point where we can collect, correlate, and analyze enough data to achieve production line perfection.
Industry 4.0 isn’t the future. It truly is already here.
Do you have the data chops to compete in Industry 4.0?
How and to what depth you collect and manage your data has a direct bearing on your ability to achieve higher performance benchmarks. To remain competitive, manufacturers must become more profitable by improving yield, increasing productivity, driving quality to higher levels, and reducing the frequency and impact of recalls.
Call that Industry 4.0 if you want, it’s just the cost of doing business in today’s economy. We talk to manufacturers all the time that struggle to make their data work for them. They suffer from inadequate and low resolution process monitoring, data silos and fragmented reporting systems, a lack of modern visualization and analytical tools, and test stations that are not optimized.
But they don’t have to. In-process testing and waveform signature analysis, coupled with the analytics and visualization tools to harness it, have been around since long before “Industry 4.0” became a buzzword.
As Chief Technology Officer at Sciemetric, Richard Brine leads the company’s total product vision, from concept to deployment and ongoing customer support. He is responsible for driving industry-leading advances across Sciemetric’s portfolio of tools and applications for in-process testing, enabling customers to realize the promise of Industry 4.0 throughout their manufacturing plants.
For more information, visit www.sciemetric.com


