


 Review the marketing collateral from some machine vision vendors and you may conclude that machine vision is the single most important element of the modern factory. While it’s true that machine vision is a crucial piece of the puzzle, it is just one of many.
Whether you’re a machine shop, a job shop, or a contract manufacturer in the supply chain of a major OEM, your success today rests with how machine vision data comes together with all the rest of your production data.
How? By making your operations more efficient, profitable and quality-focused. The terms Industrial Internet of Things “IIoT” and Manufacturing 4.0 are tossed around a lot these days. But no matter how you define either on a technological level, the end game is the same – to be more competitive.
Break machine vision out of its silo
What does it take to be more competitive today?
For many manufacturers and their suppliers/partners, it means adopting digital technologies that allow for greater automation on the production line and for greater connectivity between the plant floor, back-office and enterprise systems, as well as with other plants and suppliers. It’s about levering the power of data analytics to correlate and analyze reams of production data to predict and proactively address problems with production, output and equipment before they cost time and money, at any production site, anywhere in the world. This is the Industrial Internet of Things.
Machine vision does have a big role to play. Greater automation that cuts costs, speeds production and reduces the risk of human error relies on robots guided by cameras to sort, retrieve and mount parts, and ensure parts are lined up properly for something like a weld. Machine vision inspection catches defects in surfaces and dispensed materials.
All these things rely on an intelligent and reliable machine vision system. It all comes down to vision data. Machine vision systems don’t “see” as we do. To them, an image is a collection of thousands of data points called pixels. Algorithms analyze the patterns of pixels in an image to interpret what the image has captured. This could be to read a barcode, identify a part by its shape, guide a robot, or determine pass/fail for each cycle of a production process.
But all this still limits machine vision to a silo on the production floor. It is not being used as part of the whole to support a comprehensive IIoT strategy. So where do you begin?
 Collect the right data

Many plants have already adopted digital platforms for centralized data collection, management and analysis as part of an IIoT strategy. They understand that this kind of digital transformation is about much more than simply collecting data. The goal must be to make the data actionable, to empower the non-engineer to react to issues quickly and to create a rich data repository with which the quality engineer can experiment.
Production data from process and test stations can’t be left trapped in local servers or on someone’s laptop. All of it must be collected into an individual birth history record for each part or assembly, indexed and cross-referenced by serial number. Every station up and down the line, as well as the repair bay, should be digitally connected over a robust network architecture, to feed this data into a central database.
It’s not just about vision. This data collection must also include scalar values from SPC tools, which are useful to flag a process problem, and digital process signatures generated by each cycle of a production process or test to trace the root cause of that problem. (Every manufacturing process has a signature, visualized as a waveform that’s as unique as a fingerprint and constant when the process is under control.)
Analyze and act on the data
Now you must make all this data work for you. Machine vision images and vision data, when combined with a part’s digital process signatures and scalars, provide a powerful means to drive continuous quality improvement. This takes an investment in big data management and analysis tools that visualize their findings in a manner that lends itself to easy understanding by the engineer and non-engineer alike. If only an engineer can understand it, it takes longer to recognize a problem and address it. That means more faulty parts are slipping by.
Take an oil pan that fails a leak test. What is the cause of the failure – a faulty seal due to improper dispensing, an improperly installed gasket due to incorrect position, bolts that didn’t tighten down correctly, poorly machined surfaces due to excessive vibration at a machining center? How many different gaskets and bolts are we talking about?
Getting to the root cause of this flaw could require investigation of a dozen or more machining, dispensing, fitting and rundown operations, each with its own data set.
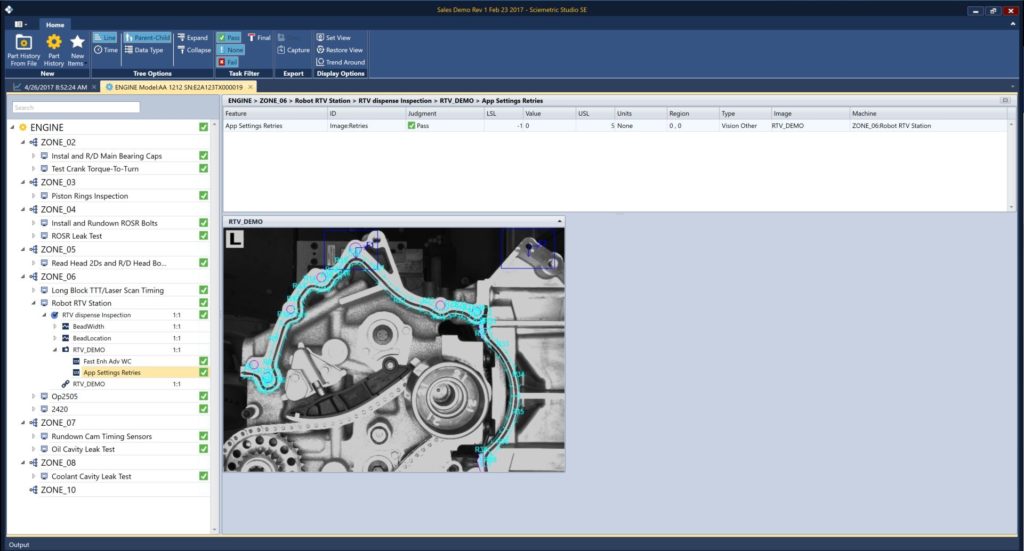
This includes the machine vision images and data that can tell you if a seal material was dispensed properly, if a gasket was present or even if a machined surface is truly flat.
What can image data tell you in this case that process signatures may not? It could, for example, determine that the average width of the gasket material bead for a region of the part was within specification, yet highlight that the maximum width of the bead was exceeded. This could indicate a micro air bubble, which caused the bead to “splat” out beyond where it should. And as any quality engineer who has had to contend with voids can tell you, a little trapped air often leads to weakened or failed seals.
Drive continuous improvement
Quality engineers use this rich repository of production data to find trends and patterns that reveal the “how” and “why” of decreases in yield and quality. They can test and apply refinements to test limits or other upstream quality control benchmarks. This gives them the insight to improve quality, reduce scrap, rework and warranty claims, and bring new lines and new plants online much faster and economically than ever before.
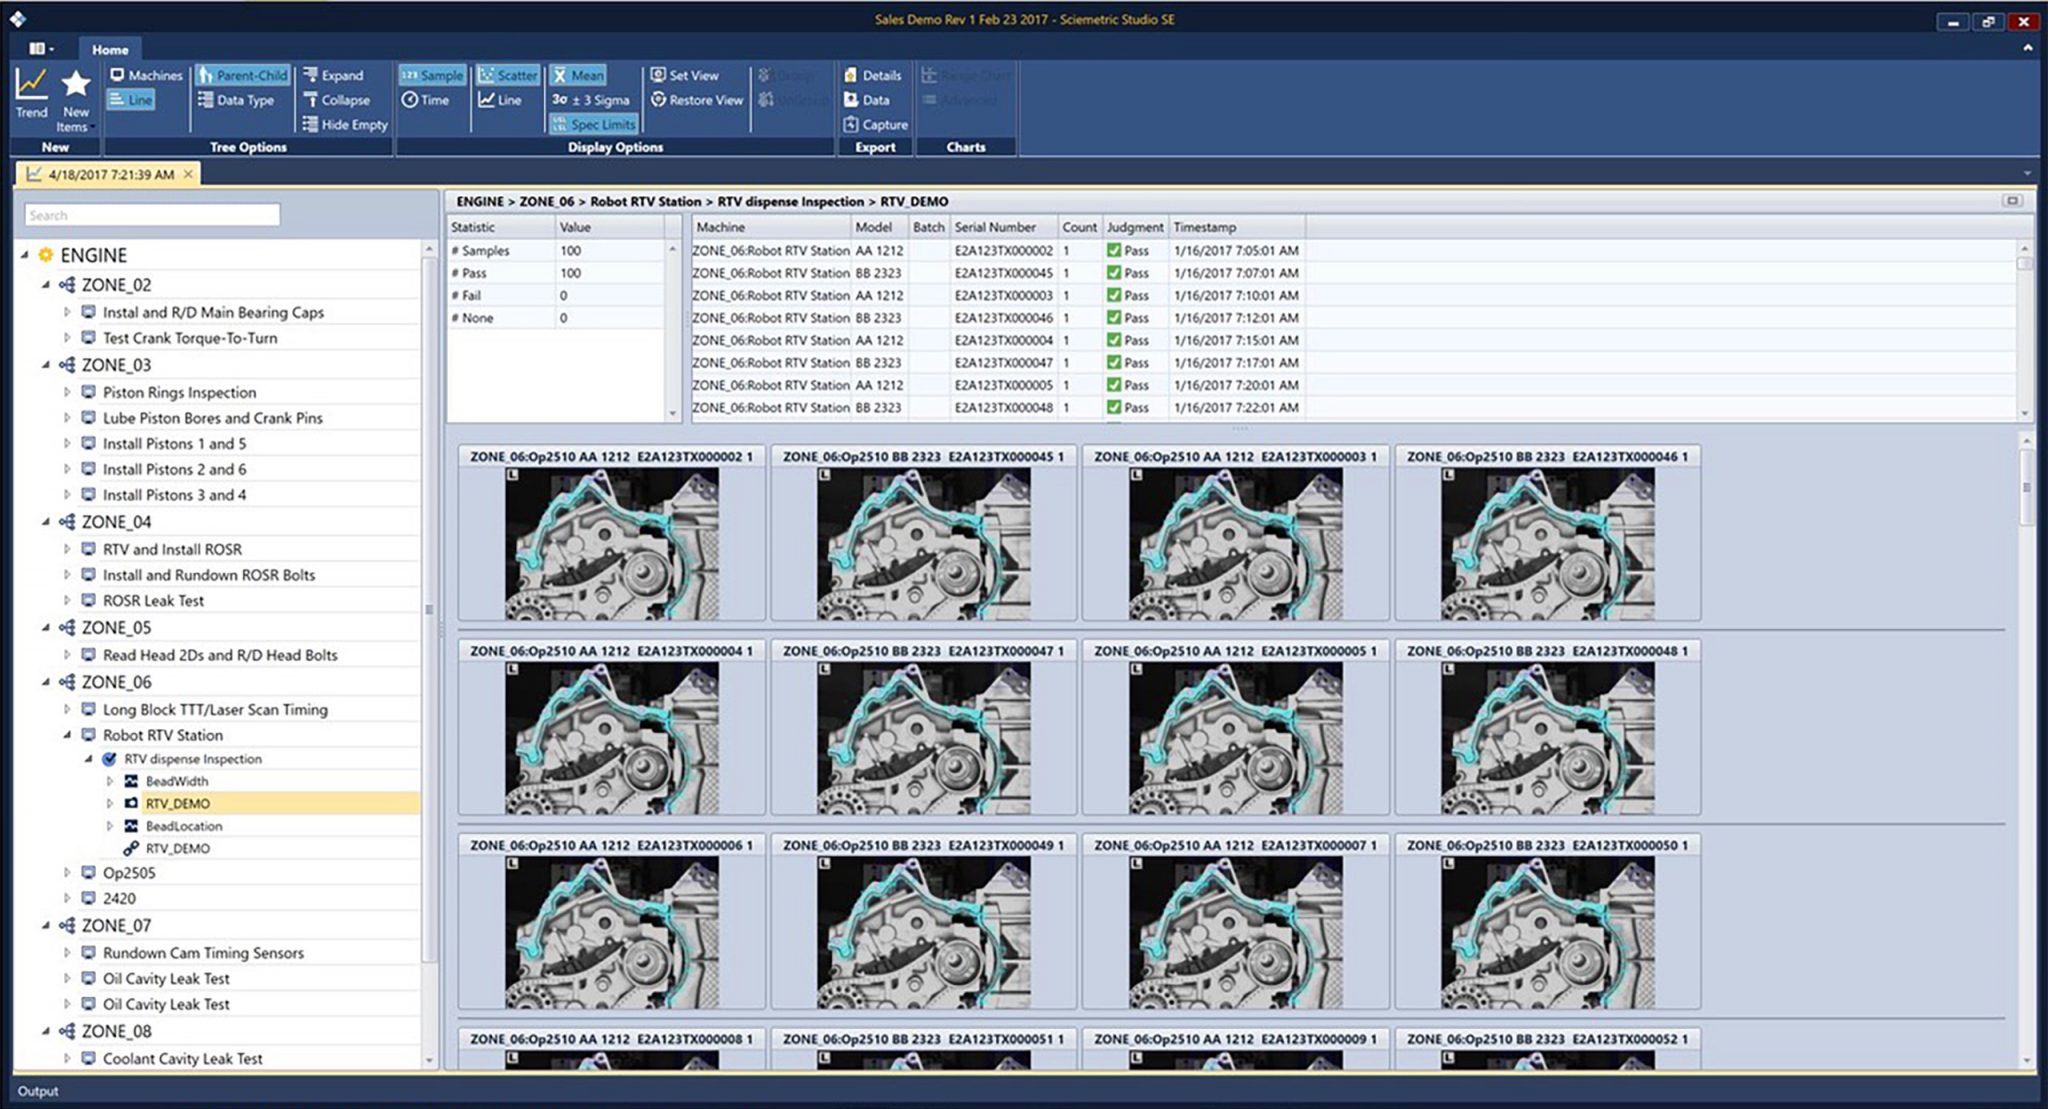 For example, image-based profile data can be used to adjust and fine tune processes such as dispense systems or robots, and to track failures. Take that dispensing operation referenced above. Bead location and width can be tracked with a digital signature. Histograms can be created that track the minimums, maximums and averages for each region of the part.
Now, say a quality engineer is having a problem with a robotic dispensing station on their line in Shenzen. With all production data enterprise-wide available on-demand to anyone anywhere else in the organization, a colleague in Detroit can cross-reference the data from comparable stations that are running at spec. In this way, they can determine what tweaks need to be made to the control limits of that dispensing station in China to address the issue.
Play what if and contain warranty issues
Determining accurate limits for a visual inspection system can require many steps: setting up initial limits, running known good and bad parts, analyzing the results, tweaking the limits, running more parts, tweaking the limits further, running more parts again and on and on. It’s a tedious process that takes time and takes over your production line while being executed.
With vision part of your data repository, you can fine-tune your processes in a virtual testbed. Simply use your historic vision data and other process data to play “what if?” by running simulations to quickly evaluate the impact of new limit settings. See the pass/fail results instantaneously so you can quickly narrow in on the boundary between good and bad parts and precisely determine new limits to effectively catch defects. Do all this from your desk in minutes instead of disrupting production equipment for hours.
Use this same what-if analysis to data mine for suspected defects if you find out your existing limits did let bad parts slip through. In this way, you can contain contaminated work-in-progress before it ships and selectively recall faulty products by serial number. Respond faster to a quality issue and accurately triage the problem to limit the scope of a recall, both in terms of cost and PR impact.
The more data you collect, the greater insight you have into what has happened to a part at every stage of production, from raw materials to final product. Anything that happened upstream can have a bearing on a problem that arises downstream.
Manufacturing 4.0 isn’t just theory, it’s become practice. Many plants are already using centralized data collection, management and analysis tools for other datasets generated by processes and test stations on the line.
Bringing machine vision images and data into this fold is the next logical step. For plants that are looking at a system for centralized data collection, management and analysis for the first time, it only makes sense to get it right from the start and ensure machine vision and vision data isn’t a forgotten part of the equation.
The cost and complexity of this kind of investment continues to fall. Manufacturers have at their disposal affordable tools that allow them to harness the true power of all their data, and that includes vision data. Doing so will give you even greater insight into production processes and tests, to achieve higher standards of quality and efficiency and troubleshoot problems faster when warranty claims come through the door.
This is how you sharpen your competitive edge and grow your business in the Industrial Internet of Things.


