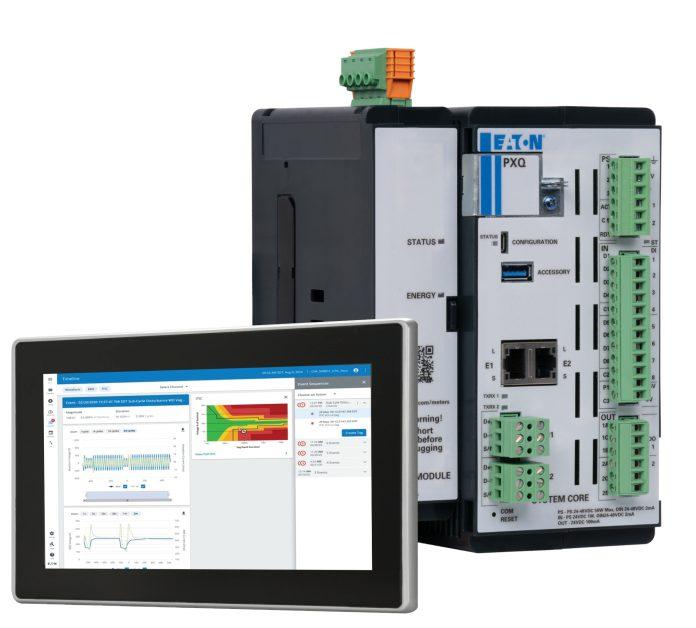
Power quality events occur for ordinary and extraordinary reasons. Whether your power is coming from the utility grid or onsite resources, maintaining a reliable supply of electrical power is critical for around-the-clock uptime.
Metering data is imperative for managing energy wisely, but most organizations are already buried in data. And ever more is coming. So how do you zero in where problems are developing without spending all day looking at “normal” electrical circuits?
Metering with root cause analysis provides essential data and first-step insights to remedy power quality (PQ) problems, so you can ensure they don’t impact your business, without requiring inspection of every individual circuit.
Powerful trends are at work
Already, 77% of companies expect to transition away from their current energy sources (source: The Intersection of Digital Transformation and the Energy Transition, July 2022). Businesses need new, intelligent tools to manage a changing mix of energy sources. Especially as electricity consumption soars, renewables are being added to businesses’ energy mix and electric vehicle (EV) adoption surges. This energy transition will generate new and far more data that businesses need to make use of and act on.
At the same time, power outages are increasing. Large-scale power outages in the U.S. have increased 64% since 2000, largely due to weather-related events (Source: Climate Central, September 2022).
No matter how energy is sourced, power-critical businesses need to keep energy flowing. Yet, one in five data centers experienced a “serious” or “severe” outage in the last three years (Source: Uptime Institute’s Outage Analysis Report, June 2022). The cost of outages is soaring, with more than 60% of failures resulting in at minimum $100,000 in total losses (up from 39% in 2019). And power-related problems make up 43% of significant outages that cause downtime and financial losses.
Focusing investments on electrical infrastructure continues to be a critical differentiator. Powerful metering and root cause analysis tools are providing critical insights, which make it possible to spot problems that would have otherwise gone unnoticed.
Standards apply – automate reporting for IEEE 519
If your local utility is enforcing the Institute of Electrical and Electronics Engineers (IEEE) 519 guideline, advanced meters can help you meet those requirements. Beyond the utility penalty costs, excessive harmonics can have wide-ranging and long-term implications for industrial, data center, commercial and other environments. Harmonics can overheat, damage and shorten the lifespan of motors, transformers, power conductors, sensitive electronics and other equipment.
The IEEE 519 Standard deals with harmonics, which introduce inefficiencies and wasteful heat into your power system and can result in fees from your local power company. IEEE 519 establishes the goals for the design of electrical systems that include both linear and nonlinear loads or harmonic producing loads.
Managing the harmonics in a power system is a joint responsibility shared between power consumers and their utility company. While some level of distortion is acceptable, how much that impacts voltage depends on the impedances in the system. Both you and your utility need to work cooperatively to keep voltage distortion below levels that cause problems.
The standard provides guidance and recommendations on harmonics limits, so your neighbors do not cause problems for your electrical system. And it establishes your local utility as the mediator for when things do go wrong. In other words, your utility will determine whether it will enforce the standard.
Meters with sophisticated reporting functionality can help you meet your utility’s requirements by analyzing each cycle and comparing harmonic content across the spectrum over time to the IEEE 519 established limits. It takes a lot of processing to determine that you stay within those limits 95% of the time (which is the threshold established in the guidelines) at the point of common coupling.
Advanced metering delivers on more than data—get actionable reporting
In today’s increasingly digital world, most organizations are buried in data. How can you make better sense of it all to establish a competitive advantage? When you have hundreds or thousands of individual circuits to monitor, you need a simpler and robust way to see what’s happening on your system. Actionable data analytics are essential to provide accurate information on where problems are developing. You cannot waste resources on looking at circuits that are operating normally.
When you suspect a problem with your electrical system, you shouldn’t need to be an expert to know what to look for to prevent or avert it. Yet power quality events often happen so quickly that they are over and done faster than an alarm. You need your meters to help demystify these power quality events and today’s advanced technology makes it a lot easier to spot problems in advance and take corrective action.
“In a world where power quality events arise from both the ordinary and extraordinary, the key to uninterrupted operations lies in the wisdom of metering data and root cause analysis. As businesses navigate a changing energy landscape and battle increasing power outages, these tools shine a light on the hidden issues, safeguarding against downtime and financial losses,” said Tony Trim, Gulf Region Lead Solution Architect, Eaton. “In the midst of powerful trends, investing in electrical infrastructure becomes the critical differentiator that ensures the relentless flow of energy, securing the future of power-critical enterprises.”
7 tips on how you can get to the root cause of power problems faster
Tip one: Leverage aggregated metrics to speed up analysis.
Meters are essential to informing a broad view of what’s happening on your system. Yet looking at information from individual meters is insufficient, especially when you have dozens or hundreds of meters. To help you take action that improves power reliability and efficiency, advanced meters provide a robust bird’s-eye view with interactive data, so you can look at events and toggle between information.
Simple to understand tools like a PQ index can identify circuits with Power Quality problems. To dig deeper into the root cause of PQ problems, users can compare statistical gauges, trend plots, waveforms and cycle-by cycle RMS plots. For example, you can see voltage levels and whether they impact load currents, and you can see the correlation between current and voltage. And by plotting current and voltage into the same graph, you can make more sense of what’s happing in your power system. To dig even deeper into the root cause of PQ problems, you can compare statistical gauges, trend plots, waveforms and cycle-by-cycle root mean square (RMS) plots.
Tip two: See what’s happening over the duration of multiple events.
When you your lights flicker, it’s hard to say whether the cause is internal or external. Yet, these power quality events can be a challenge for hospitals, data centers and anywhere that power reliability is mission critical. Knowledge of what’s driving power events enables you to address and rectify them while minimizing downtime.
Today, you can see what’s happening and put multiple events in context through your meter. That gives you the data to better protect your infrastructure and talk with your utility (if the events are a regular occurrence). For example, if there’s a fault on the line, reclosers open and close, creating an inrush, which has adverse impact on motors. Armed with a documented Power Quality event history, you can discuss what your Utility Company can do to reduce the occurrence of these events.
Tip three: Spot patterns with a calendar view.
When power quality events occur regularly or seasonally, you can identify the patterns in a calendar view and determine if an issue coincides with a regular process, like testing of standby generators. In the meter’s calendar view, you can see the timeline of what occurred and see patterns of power quality events impacting equipment.
Tip four: Benchmark energy usage and see how energy-saving measures are working.
Your meter can help you trend your energy demand over time, accumulated energy savings, peak demand and the amount of energy you use. You can also see energy flows in either direction, whether you’re taking power in from the grid or shedding excess power generated. And you’re able to understand when your onsite solar or energy storage resources are kicking in to support your facility and offset power from the grid.
Tip five: Track phase balance.
Phases can become unbalanced. In order to predict and rectify phase imbalances, you need to see the trends, not just the trigger point. With this graph you can see how phase data drifts apart before it reaches a trigger point.
Tip six: Determine if power sags are impacting your business.
Identifying power sags has historically been somewhat of a guessing game. Previously, RMS plots would typically offer too little information; available data provided a microscopic view (with the waveform) and broad five-minute interval, which would shed some light but make it difficult to determine when and why a power sag occurred.
With the newest meters, you have a lot more information on what occurred during a power sag and can set alarms and triggers to help avoid future events. You can see anomalies in voltage, current, frequency and power through plots featuring 5-minute interval readings. A newly available two-minute cycle-by-cycle RMS view at a high resolution, with one-cycle readings can help you understand what led up to or resulted from an event. While there is still detective work involved in identifying and preventing power sags, there is a lot more information at hand.
Tip seven: Take the guess work out of your analysis
Traditionally, your meter would provide individual waveform analysis for each power quality event. The information can be disjointed and even the RMS plots would have limited utility by themselves because they did not provide much context. Now, you can get a much fuller picture from your meter and see how events relate to each other.
For example, when the lights flickered in a stadium during a big game years ago, a two-minute recording of what was happening could have helped get the lights back on faster by understanding the root cause of the event. The graph would have shown why there was an event, and that turning everything on simultaneously would cause an inrush that would overload the generators. The bottom line is that you need information to make decisions on how and when things need to run, and you need visibility into potentially developing problems.
Meters can help you both see the forest and the trees with relatively easy-to-digest information even if events happen on different days. And you can see the full picture of what occurred with longer capture information at a lower resolution, so you can see what happened and how different waveforms relate to each other with the RMS plot.
Move beyond simple metering to advance uptime, productivity
With energy sources changing and everything electrifying, focused investments in your power systems can be a critical differentiator. And robust, advanced metering capabilities are setting a new standard for power distribution system event diagnostics.
Powerful metering and root cause analysis tools are providing the critical insights you need to spot problems that would have otherwise gone unnoticed and prevent them from happening again. These capabilities can transform your day-to-day operations from simple measurement to intelligent insights – so you can focus on your business mission instead of analyzing metering data for your critical systems.
When it comes to power quality, it’s not just about the amount of data you can capture, it’s about capturing the right data exactly how and when you need to.
By: Karen Cheung, Product Manager, Eaton


