


As manufacturers continue to outfit and upgrade packaging machinery to comply with regulations, the extra steps in serialization (and aggregation) will bring an unwelcome 5-10% reduction in overall equipment effectiveness (OEE)—this is typical, as experienced by early adopter countries like Turkey. Some companies have seen decreases of 20-30%.
The good news? With serialization incorporation, any process causing an initial slowdown can produce data that, when properly interpreted, can reveal a roadmap to restoring OEE to pre-track & trace levels, or even higher. Data generated by serialization compliance can be parlayed into guideposts for improving production practices. The metrics are there for the mining, allowing manufacturers to track & trace their operations.
Serialization implementation and the data mining it affords are the first vital steps toward transforming production facilities into digital factories, whose foundations are built on web-enabled & data-driven technologies. Its advantages touch every aspect of manufacturing, including enterprise-wide resource allocation, asset tagging, and real-time inventory and personnel tracking.
 Digital Factory Transformation in 3D
Tomorrow’s digital factories will be in “3D,” a three-tiered digital transformation process to successfully deliver the promise of smart manufacturing, or Industry 4.0. The race is on for manufacturers to optimize production practices by navigating from data to dashboards to decisions. In doing so, they will apply mined information toward comprehensive yet digestible operational feedback that, in turn, leads to logical adjustments for improved production practices.
- Data: Unique unit-level serial numbers for enhanced supply chain product visibility are only the beginning. Emerging IoT technologies like wireless sensors and gateways offer opportunities to enhance datasets collected by traditional “transaction-based” systems like ERP, MES and WMS. Additional environmental and location-based data can tremendously enrich previously untapped metrics with unprecedented granularity. If there’s a fourth D, it’s “details.”
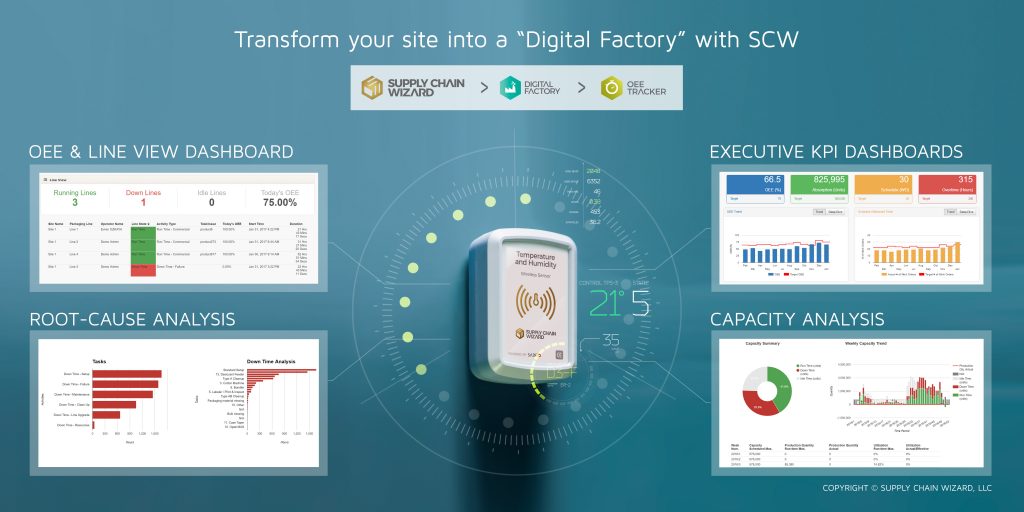
- Dashboard: Converting raw data into actionable insights through business and management platforms, made available to personnel throughout an organization depending on their specific roles. For example, managers could access live dashboards showing all production lines, and view pre-configured reports showcasing exceptions, trends, and downtimes in unprecedented detail. Undesirable situations can be addressed faster and more effectively. Conversely, optimum outcomes are identified so that ideal conditions can be replicated.
- Decisions: Data and dashboards are utilized for critical resourcing and prioritization decisions. For example, scheduling work orders on shop floors using real-time data and historical trends can significantly improve resource utilization and overtime/waste reduction, while increasing capacity and throughput.
Tracking Your Track & Trace Operations
Recently, a client faced the challenge of significant efficiency loss while upgrading a pilot bottle packaging line with serialization/aggregation technologies. Concerned with post-compliance OEE impact, our two companies jointly developed a solution that digitally tracked line operations. We called it OEE Tracker. The project ran for a year, expanding into all facility packaging lines. The tracking system proved highly successful in revealing a variety of issues.
 Visibility
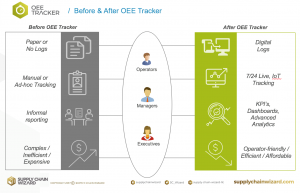
By replacing manual and/or paper-based tracking activities with digital tracking capabilities, the starkest improvement occurred in operational visibility. Live dashboards of operations detailed unexpected stops and production delays, revealing root causes and pinpointing their locations. Implemented on multiple lines, the OEE Tracker also afforded comparisons between similar lines, indicating each line’s strong and weak points.
Variability
Through digital tracking, certain procedure-driven activities showed significant variability in duration. Here, digital factory implementation feeds upon itself by identifying sources of variability and, in turn, allowing manufacturers to home in on the root causes of these variabilities. For example, in many case knowing the number of operators available to conduct a certain procedure makes the procedure’s duration more predictable.
Exceptions
Once the visibility and newly found capability of “variability tracking” were in place, our client was able to define what is “regular” or “acceptable,” and what is an exception. Tracked activities are assigned an expected duration, as well as maximum (and in certain cases minimum) allowed duration. Algorithms automating the reporting of exceptions provide reports highlighting exceptions for managers to analyze and ultimately improve upon.
“Call Support”
Another important area the OEE Tracker troubleshoots is real-time personnel allocation: the time it takes to find the proper personnel for a project, exactly when required, at any given line. For example, bringing the right quality assurance (QA) personnel to release the line after it has been cleaned could sometimes take up to an hour. Similarly, getting the right mechanic to a line for impromptu maintenance causes costly line stoppages. A simple “call support” function implemented in the OEE Tracker solution now notifies desired workers via emails/texts with comprehensive instructions on when and where to report.
Scheduling & Beyond
Of course, real improvement in efficiency isn’t possible until a true change of operational behavior occurs. The incorporation of digital tracking already contributed to our client’s OEE performance; without any policy change, an improvement of 10-15% is achieved by the change in behavior of supervisors & operators.
More fundamental performance improvement, however, required a fresh look at how work-orders were scheduled – an effort to minimize overtime and reduce changeovers. Given a digitally strong foundation of OEE Tracker and a digital log of all shop floor activities, a more robust scheduling process was created. Early results from the analysis of actual monthly schedule data is quite promising, with 10-20% reduction in labor cost – primarily due to reduced over-time – and a potential increase in capacity/throughput of 20-40% through improved scheduling capabilities; namely, ones using mathematical modeling and machine learning algorithms to constantly improve data-sets for more informed decision making.
Conclusion
In all, our work with our client improved the way they manage their packaging operations. After incorporating the OEE tracker, the company quickly highlighted areas that impeded productivity, calculating and ultimately utilizing metrics for line operations that significantly improved efficiency. Having worked extensively with our client, we have concluded that while data is important, all three aspects of “3D”—including dashboards for operational insights and decisions for actual step change in behavior — must work together to form a complete solution, one that we know is possible with the support of software solutions, IoT sensors and an open-minded and supportive leadership.
About the Author
Evren Ozkaya, Ph.D., is Founder & CEO of Supply Chain Wizard, LLC. Dedicated to optimizing operations for growth, service and efficiency, Supply Chain Wizard offers strategic innovations in products and services targeting serialization and supply chain transformation initiatives, along with a team of expert consultants providing comprehensive support toward cost-effective compliance with serialization mandates and post-go-live operational support.


