There are many different opinions on the state of the U.S. economy. This is normal when we are entering an election year. The political party in power wants the economy to appear good or better than the previous administration, and the opposing political party wants it to appear worse than when they were in power.
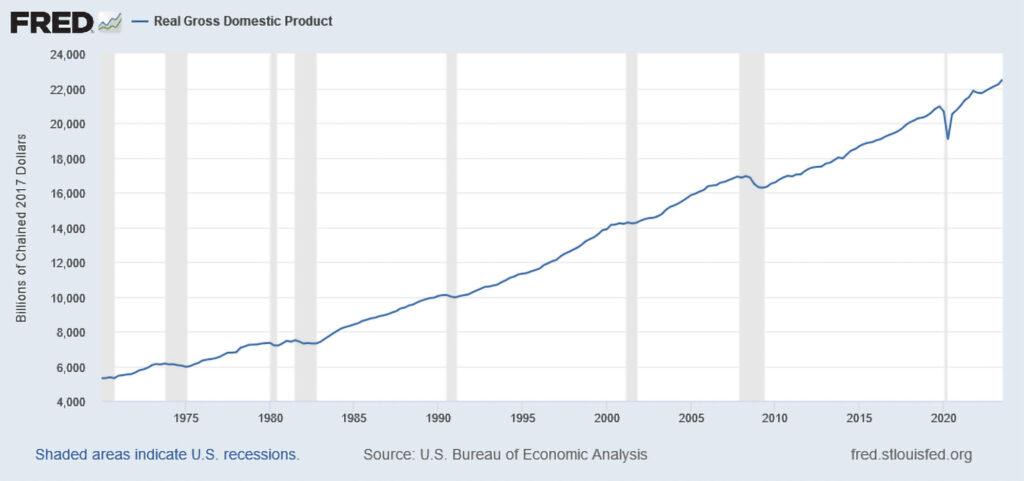
Let’s examine what are the key economic indicators as well as other data to determine the true state of the U.S. economy. According to the website, USA Facts, the key economic indicators are: GDP, inflation, Federal Reserve interest rates, workers’ average hourly wages, unemployment rate, ratio of unemployed people related to job openings, labor force participation rate, trade deficit (imports vs. exports), and Federal debt. USA Facts only reports the figures at the end of the year so the data shown is for 2022 since 2023 hasn’t ended yet.
Labor Force Participation Rate
The rate is calculated as the labor force divided by the total working-age population. The working age population refers to people aged 15 to 64. This indicator is broken down by age group and it is measured as a percentage of each age group.
The labor force participation rate was 66.0% in 2008, and gradually dropped down to 63.3% by January 2020. As a result of the COVID-19 pandemic, it dropped to a low of 61.5% in November 2020 before gradually rising to 62.8% in November 2023.
Ratio of Unemployed People to Job Openings
According to the Bureau of Labor Standards, “The ratio of unemployed people to job openings ranged from 0.8 to 1.0 during 2018 and 2019. Over the past 5 years, the number of unemployed people per job opening reached a high of 4.9 in April 2020, when there were 23.1 million unemployed people and 4.7 million job openings. Since October 2021, the ratio has been 0.5 or 0.6 every month…When ratios equal 1.0, there is approximately 1 unemployed person per job opening. When less than 1.0, the labor market is tight, as job openings outnumber the unemployed. When greater than 1.0, there are more unemployed people than available jobs..”
The unemployment rate of the United States, which has been steadily decreasing since the 2008 financial crisis, but spiked to 8.1 percent in 2020 due to the COVID-19 pandemic. The annual unemployment rate of the U.S. since 1990 can be found here.
Federal Fund Interest Rates
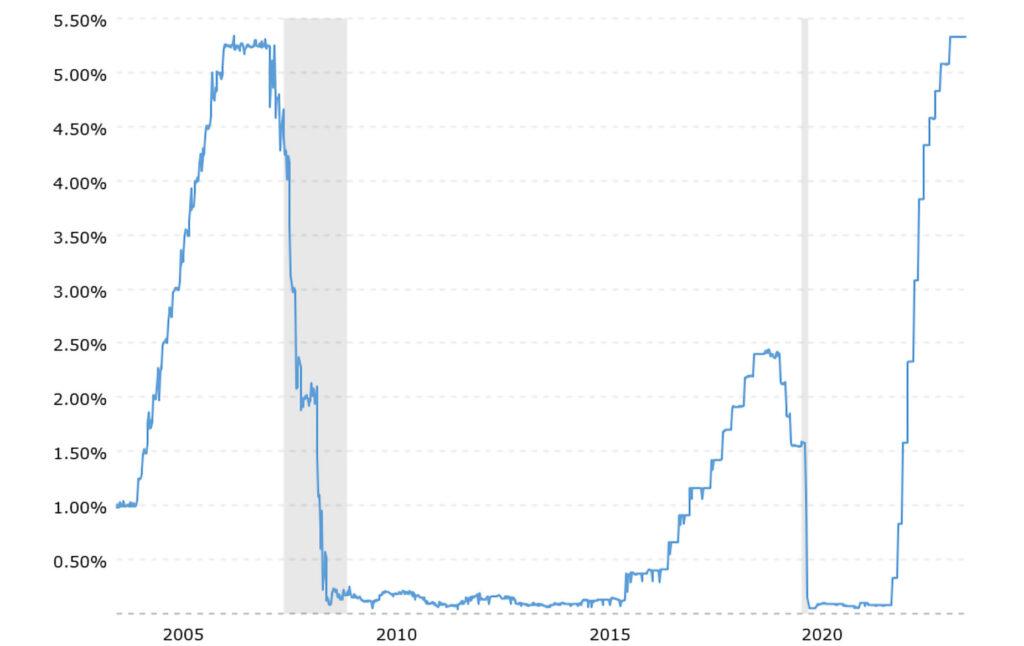
The Federal Reserve raised interest rates seven times in 2022 and four times in 2023, increasing the target rate from nearly zero (0.25%) in 2020-2021 to 5.25%-5.50% currently. The Fed is expected to hold rates steady when they meet this month. The Fed rate affects the consumer interest rates for mortgages and installment loans for things like cards, home furnishings, and other consumer goods. Mortgage rates have risen from 2.75-3.25 in 2021 to 6.0%-7.9% in 2023. This has stagnated sales for homes and automobiles.
https://www.macrotrends.net/2015/fed-funds-rate-historical-chart
National average wage indexing series, 2001-2022
It looks like wages have nearly doubled in 21 years, but the value of the dollar has changed over time. According to the CPI Inflation Calculator, the ”U.S. dollar has lost 42% its value since 2001; $100 in 2001 is equivalent in purchasing power to about $173.73 today…The dollar had an average inflation rate of 2.54% per year between 2001 and today, producing a cumulative price increase of 73.73%.” Thus we need to deduct 42% from the 2022 wage to compare it to 2001 ($63,795.13 – $27,431.91 = $42,363.23). Thus, the wages only went up by 34% while inflation increased 73.73%.
Table: National average wage indexing, 2001-2022
| Year | Annual Wage | Year | Annual Wage |
| 2001 | $32,921.92 | 2012 | $44,321.67 |
| 2002 | $33,252.09 | 2013 | $44,888.16 |
| 2003 | $34,064.95 | 2014 | $46,481.52 |
| 2004 | $35,648.55 | 2015 | $48,098.63 |
| 2005 | $36,952.94 | 2016 | $48,642.15 |
| 2006 | $38,651.41 | 2017 | $50,321.89 |
| 2007 | $40,405.48 | 2018 | $52,145.80 |
| 2008 | $41,334.97 | 2019 | $54,099.99 |
| 2009 | $40,711.61 | 2020 | $55,628.60 |
| 2010 | $41,673.83 | 2021 | $60,575.07 |
| 2011 | $42,979.61 | 2022 | $63,795.13 |
Data source: https://www.ssa.gov/oact/cola/AWI.html
Trade Deficit
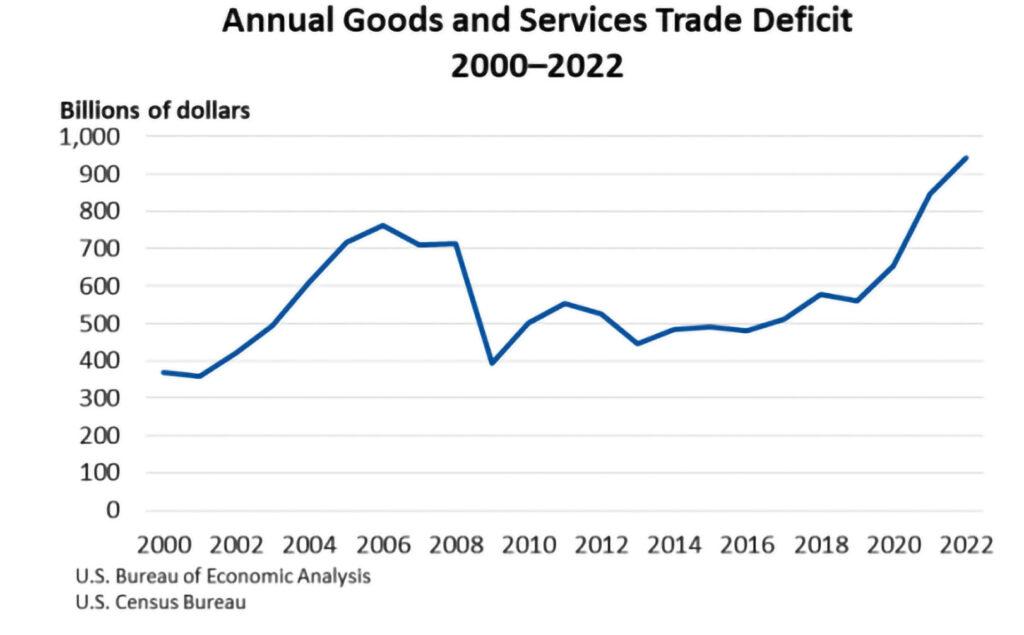
The last year that the U.S. had a positive trade balance by exporting more than we imported was 1979. The trade deficit grew gradually from 1980 – 1999, but accelerated after China was granted Most Favored Nation status in the year 2000. In 2022, the trade deficit of $948.1 billion is a 3.9% increase from 2021.
bea.gov/news/blog/2023-03-08/2022-trade-gap-9453-billion
U.S. Private Sector Job Quality Index
The November Job Quality Index report by The Coalition for a Prosperous America states, “The Job Quality Index measures job quality for U.S. production and nonsupervisory workers by comparing workers’ weekly wages to the mean weekly wage for all non-supervisory workers. Those jobs above the mean are classified as high-quality and those below the mean are low-quality…Over the past three decades, the JQI declined because the U.S. economy created more low-quality jobs than it has high-quality jobs. As shown in the Job Quality Index graph, the JQI is down 12.8% from 1990 illustrating the disproportionate growth in low-wage, low-hour jobs.”
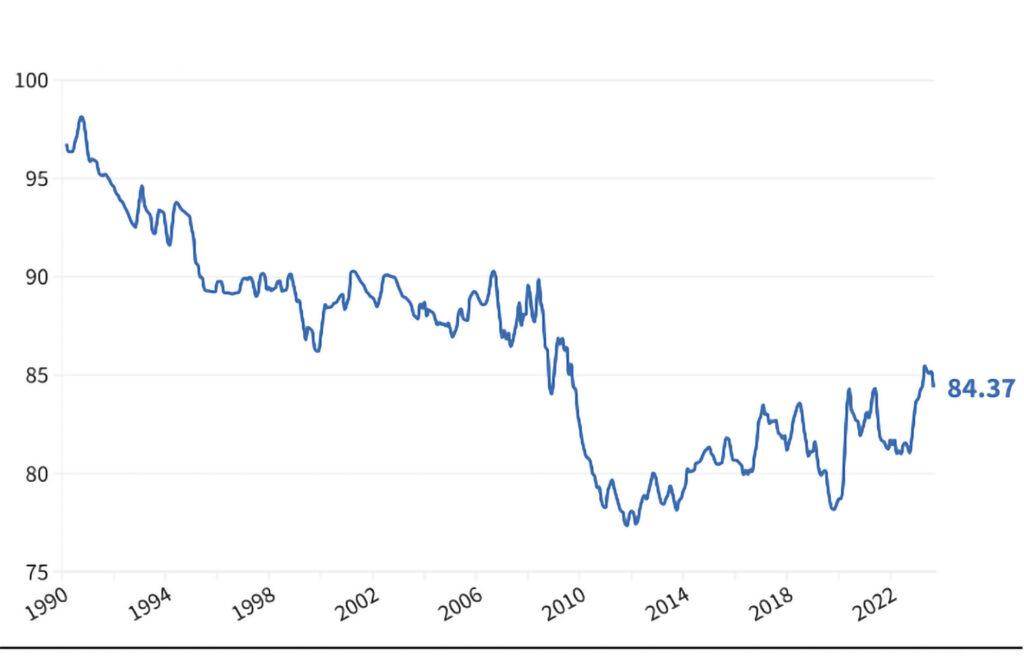
For my industry of manufacturing, there are two other measures that can be examined to determine the true state of the economy. They are:
1. US ISM Manufacturing PMI
The Institute of Supply Management Purchasing Managers Index “is a diffusion index summarizing economic activity in the manufacturing sector in the US. The index is based on a survey of manufacturing supply executives conducted by ISM. Participants are asked to gauge activity in a number of categories like new orders, inventories, and production and these sub-indices are then combined to create the PMI… A PMI above 50 would designate an overall expansion of the manufacturing economy whereas a PMI below 50 signifies a shrinking of the manufacturing economy.
US ISM Manufacturing PMI was at a level of 46.70 on November 30, 2023, unchanged from 46.70 for October and down from a recent high of 64.70 in March, 2021. The PMI dropped to 49.00 for the November, 2022 report, so we have been in a shrinking economy for 13 months.
2. U.S. Manufacturing Technology Orders
According to the November report published by AMT, The Association For Manufacturing Technology, “orders for manufacturing technology…continued to fall relative to 2022. Through October 2023 orders totaled $4.05 billion, 13.5% behind the total for the first 10 months of 2022.
Conclusion
Adding to the above data is the fact that vehicle gas prices have escalated since 2020. According to Finder, “Gas prices in over the last 12 months are well above the national average over the last six years, hitting $4.99 a gallon in the week of June 16, 2022 — a week in which Californians paid a whopping $6.43 per gallon…The national average gas price this week [December 7th] is $3.22, down from $3.27. US gas prices over the last year are among the highest since 2018. California has the highest gas prices in the nation, followed by Hawaii as a close second, and Washington, Nevada, and Oregon making up the top five. Texas has the lowest gas price ($2.68) in the nation followed closely by Mississippi ($2.72) and Oklahoma ($2.74).
According to the U.S. Government Accountability Office, “Last year, U.S. consumers saw the largest annual increase in food prices since the 1980s. While food prices generally increased about 2% in prior years, they increased about 11% from 2021 to 2022…Food prices also varied by locality. For example, the highest increase between 2021 and 2022 was seen in Detroit Michigan (about 14.5%). The lowest (about 5%) occurred in the Miami-Fort Lauderdale, Florida metro area…Finally, food price increases from 2021 to 2022 varied by food group. For example, prices for grains and bakery products increased by about 13%, while fruits and vegetables increased by about 9%. Similarly, dairy products increased by about 12%, but meats, poultry and fish increased about 10%.”
I am not an economist qualified to do an educated analysis of all of the above data, but it is obvious to me that the U.S. economy has some serious problems that need to be urgently addressed if we want to avoid a prolonged recession. The question that voters ask themselves in an election year, “Am I better off now than I was under the previous administration.” The answer to that question will determine the outcome of the next election.
By: Michele Nash-Hoff


